What is a knowledge graph & why does it matter for AI visibility?
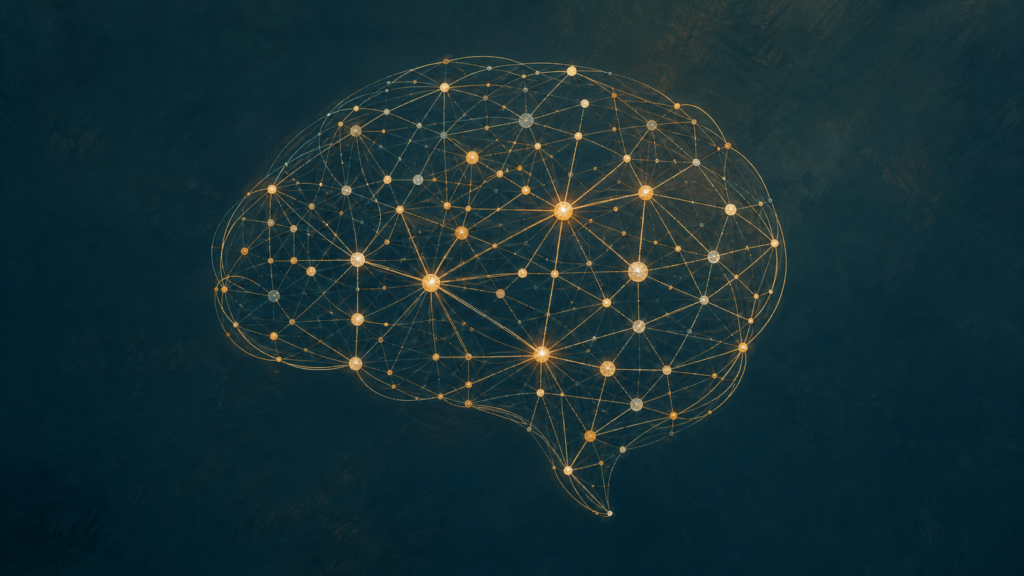
A knowledge graph represents interconnected entities, their attributes, and relationships in a way machines can read. For AI visibility, it matters because AI can understand context and infer meaning instead of just matching keywords.
There’s a lot of data out there. Too much, honestly. AI’s ability to understand it, not just process it, is where the real split happens. Traditional databases chop things into isolated facts, and that works until the connection is the point. This article looks at how knowledge graphs fill that gap, turning raw data into something AI can actually use. We’ll cover how they work and why they matter for intelligent systems.
For a deeper dive, explore our AI visibility and GEO audit.
If you want AI to work well, you need to understand knowledge graphs. They’re not optional in serious AI systems anymore. Our take: teams often treat them like infrastructure plumbing, then act surprised when model outputs are hard to explain. This covers what they are and why they work, showing how semantic networks help AI get things right, find what’s relevant, and explain its reasoning. By the end you’ll know what a knowledge graph is and why it matters for organizations trying to make AI useful.
What is a Knowledge Graph?
A knowledge graph represents information by modeling real-world entities and how they connect. It uses a graph structure to capture complex relationships, letting AI systems understand context and infer new facts from the connections between ideas.
Entities, relationships, and attributes.
A knowledge graph has three core parts: entities, relationships, attributes. An entity is a real-world thing or concept—a person (Elon Musk), a company (Tesla), a place (California), or an idea (Artificial Intelligence). Entities become nodes in the graph. In a tech company graph, “Apple Inc.” is distinct from “Apple the fruit.”
Relationships, or edges, show how entities connect. Example: “Elon Musk” (entity) “is CEO of” (relationship) “Tesla” (entity). Other relationships include “founded” or “located in.” Add “produces” and “collaborates with” when the domain needs them. They’re directional—”Elon Musk is CEO of Tesla” is not the same as “Tesla is CEO of Elon Musk.” Sounds obvious. It isn’t always modeled that way. Good graphs have many different types of relationships, which helps you understand complicated domains.
Attributes (or properties) add detail to entities and relationships. They’re key-value pairs. Tesla might have “founding year: 2003,” “headquarters: Austin, Texas,” “market cap: $800 billion.” The relationship “is CEO of” might have “start date: October 2008.” Attributes give the data points needed for deep queries and reasoning.
Knowledge graphs versus databases and semantic networks.
Relational databases store data in tables with fixed schemas. Relationships are buried in foreign keys. Querying across multiple tables costs computation and requires complex JOIN operations. They work for structured, tabular data, but struggle when schemas change or data is highly connected. Changing your data model means a full schema migration—inflexible compared to a knowledge graph.
Semantic networks are conceptual graphs of nodes and links. They focus on concepts and how they relate, going back to AI research in the 1960s and 70s. But they lacked formal semantics, consistent schemas, and reliable ways to handle massive data integration and queries. Most guides make semantic networks sound like early knowledge graphs. That’s only half right. They had the shape, not the operational discipline.
Knowledge graphs combine the strengths of both. They use graph database technology to store and traverse complex relationships efficiently. They’re flexible with schema—you can add new data sources and evolving domains without rebuilding everything. Knowledge graphs use formal semantics, usually RDF (Resource Description Framework) and OWL (Web Ontology Language). These standards let you define entities and relationships in ways machines can interpret, enabling reasoning and consistency checks. That semantic layer is what lets AI systems understand what data means and how it fits together.
How do Knowledge Graphs Represent Information?
Knowledge graphs represent information as a network of interconnected entities and relationships using a flexible structure machines can read. This makes semantic meaning explicit and lets AI systems understand context, then navigate complex data relationships.
The triple store model: subject-predicate-object.
At the core of knowledge graphs is the triple store model, also called RDF (Resource Description Framework) triples. It breaks everything into subject, predicate, object. Take “Albert Einstein was born in Ulm.” As a triple: (Subject: Albert Einstein, Predicate: bornIn, Object: Ulm). Each part gets a unique identifier called a URI. Albert Einstein becomes http://dbpedia.org/resource/Albert_Einstein, bornIn becomes http://xmlns.com/foaf/0.1/bornIn, and Ulm becomes http://dbpedia.org/resource/Ulm. This standardization lets data flow between different sources. Another example: (Subject: Apple Inc., Predicate: foundedBy, Object: Steve Jobs). Simple and powerful. You end up with a massive web of facts. In traditional databases, relationships are implicit through foreign keys. Here they’re explicit—first-class citizens. The graph structure captures what databases lose.
Schema and ontology for structured data.
Triple stores give you the basic pieces. Schema and ontology add the structure and semantic richness that make knowledge graphs work. A schema defines what kinds of entities and relationships exist in your graph—it’s like a blueprint. An “Employee” entity might have properties “hasName” (a string) and “worksFor” (an organization). Ontologies go deeper by adding formal definitions, rules, and constraints. An ontology might say “Employee” is a type of “Person” and “Manager” is a type of “Employee.” It could specify that “worksFor” and “hasEmployee” are inverses.
Why does this matter? Because those semantic rules enable reasoning instead of lookup. If an AI knows “John worksFor Google” and “Google isA TechCompany,” it can infer “John worksFor a TechCompany” even if that exact triple doesn’t exist. Languages like OWL (Web Ontology Language) and RDFS (RDF Schema) define these structures. They let the graph understand meaning and how things relate—crucial for semantic search, question answering, and complex data analysis. Without a solid schema and ontology, you just have disconnected facts.
Why Does AI Need Structured Knowledge?
When AI has structured knowledge, it can reason instead of just recognize patterns. Unstructured data is everywhere but lacks explicit relationships and semantic context, which limits AI’s ability to interpret accurately and make smart decisions.
The limitations of unstructured data for AI.
Over 80% of data generated today is unstructured: text, images, audio, video, sensor readings. Large language models can process this and generate human-like text. But their “understanding” is shallow—statistical patterns, not real semantic comprehension. Honestly, this is where a lot of AI demos look better than the production system underneath. An LLM might spot keywords in a medical report but fail to connect a symptom to a test result to a treatment without explicit structure. Unstructured data is ambiguous and lacks explicit relationships.
A sentence like “The patient experienced fever and cough; pneumonia was suspected” requires the AI to infer that fever and cough are symptoms, pneumonia is a diagnosis, and “suspected” means it’s uncertain. Without structure that explicitly says “symptom_of,” “diagnosis_for,” “certainty_level,” AI operates on probability, leading to wrong guesses, hallucinations, and decisions no one can trace. In fraud detection, unstructured emails might have subtle hints, but without a graph connecting people, transactions, and suspicious activities, AI misses patterns that would show a coordinated scheme. Unstructured data also makes AI slow and resource-hungry. Models burn through compute just to extract basic entities and relationships, often imperfectly.
Contextual understanding and reasoning for intelligent systems.
Structured knowledge—especially in knowledge graphs—gives AI the semantic context and relational framework it needs for real understanding and reasoning. Instead of just recognizing words, AI can understand what they mean in relation to other concepts and events. Take “Apple.” In unstructured text, it could mean the fruit, the company, or a person’s name. A knowledge graph says “Apple (company)” and links it to “CEO: Tim Cook,” “products: iPhone, Mac,” “industry: technology.” That clarity lets AI do more sophisticated reasoning.
Imagine a supply chain AI using a knowledge graph to trace how a port disruption impacts a supplier, which affects component production, which delays assembly. The AI understands causation, not just correlation. In drug discovery, AI uses knowledge graphs to reason about genes, proteins, diseases, and compounds, finding new therapy targets by traversing biological pathways. Is this overkill? For systems that need to explain decisions and work reliably in messy real-world environments, no.
How Do Knowledge Graphs Enhance AI Visibility?
Knowledge graphs improve AI visibility by providing structured, contextualized data that AI can interpret. They power better search results and rich snippets, while helping AI understand complex queries and making information more discoverable.
Improving search engine understanding for complex queries.
Modern search engines like Google and Bing use knowledge graphs to go past keyword matching and understand what people actually want. When someone searches “What is the capital of France and its population?”, a keyword system struggles to synthesize an answer from multiple pages. A knowledge graph has the entities (France, Paris), attributes (capital, population), and relationships (Paris IS_CAPITAL_OF France, Paris HAS_POPULATION 2.14 million). The search engine retrieves these facts directly and gives a precise answer instead of a list of links. Google’s Hummingbird and RankBrain algorithms use knowledge graph data to figure out what users really mean, even with messy phrasing.
Counter to the usual advice, this is not just about adding markup and waiting for rankings to move. Content that aligns with structured facts ranks higher because the engine can confidently assert its relevance. Websites that embed structured data (Schema.org markup) contribute to these graphs and show search engines that their content is semantically rich and directly answerable. That improves visibility for relevant, complex queries.
Rich snippets, featured snippets, and answer boxes.
For regular users, the most obvious benefit shows up in search results: rich snippets, featured snippets, answer boxes. These take up prime real estate on the results page. Rich snippets add extra data like star ratings and prices. Event dates too. A recipe site using Schema.org markup displays cooking time, ingredients, and reviews right in the search result.
Featured snippets and answer boxes go further—they answer the question on the results page itself, sourced from a high-authority page the search engine identified. Search “how to tie a tie” and you get a step-by-step guide right there. That direct presentation, powered by semantic understanding, drastically improves user experience. It also lifts visibility of the source content. For businesses, appearing in these positions is a huge advantage.
What Role Do Knowledge Graphs Play in Natural Language Processing (NLP)?
Knowledge graphs strengthen NLP by providing structured, contextual understanding, moving beyond keyword matching to semantic comprehension. They help AI identify entities accurately, resolve ambiguities, interpret sentiment, and generate precise responses for question answering and conversational AI.
Entity recognition, disambiguation, and sentiment analysis.
In NLP, accurately identifying words and phrases matters. Knowledge graphs provide the semantic backbone. In entity recognition, an NLP model might see “Apple” and freeze—fruit or company? A knowledge graph links “Apple Inc.” to attributes and relationships. The NLP system uses context to pick the right one. Google’s Knowledge Graph helps its search engine handle “movies starring Tom Hanks” by linking his filmography.
Disambiguation is where this helps most. “Bank” could mean a financial institution or the edge of a river. A knowledge graph has separate nodes for each, with their own properties and relationships. When an NLP model reads “we deposited money at the bank,” the graph resolves it to “financial bank” with high accuracy. This matters for information extraction and machine translation. Sentiment analysis improves too. Instead of marking “bad” as negative everywhere, a knowledge graph understands context. “Bad” in “that’s a bad movie” refers to quality; in “we feel bad for him” it refers to empathy. By linking terms to concepts in a graph, NLP systems detect more nuanced sentiment.
Question answering and conversational AI.
Knowledge graphs show their power in question answering and conversational AI. Traditional QA systems rely on keyword matching and statistical models, which struggle with complex, multi-hop questions. “Who directed the movie starring the actor who played Iron Man?” requires understanding chains of relationships. A knowledge graph can traverse: “Iron Man” → “Robert Downey Jr.” → “Avengers: Endgame” → “Anthony and Joe Russo.” QA systems give direct, factual answers instead of just relevant documents. IBM Watson uses extensive knowledge graphs to parse complex medical questions and provide answers at high accuracy in specific medical domains.
In conversational AI, knowledge graphs enable more natural, context-aware exchanges. Chatbots with knowledge graphs can maintain state, remember previous turns, and infer user intent more accurately. If someone asks “What’s the weather like in London?” and then “How about Paris?”, the graph helps the AI understand that the follow-up refers to Paris’s weather. It feels human. Virtual assistants like Alexa and Google Assistant use underlying knowledge graphs to answer factual questions, control devices, and understand complex commands by mapping natural language to structured actions and entities.
How Do Knowledge Graphs Impact Recommendation Systems and Personalization?
Knowledge graphs strengthen recommendation systems by providing rich, interconnected understanding of entities and relationships. AI can move beyond “people who bought X also bought Y” to deliver accurate, context-aware suggestions and personalize experiences dynamically.
More accurate and context-aware recommendations.
Traditional recommendation systems—collaborative filtering or content-based filtering—work okay. But they struggle with cold-start problems, sparse data, and lack explainability. Knowledge graphs add a semantic layer that captures relationships between items, users, and attributes. In e-commerce, a KG doesn’t just know “User A bought ‘The Martian’ and ‘Interstellar.'” It knows both are science fiction, directed by Ridley Scott and Christopher Nolan, involve space, and got critical acclaim. When User A searches “space opera,” the KG can recommend “Dune” even if User A never touched it, because the graph connects them through science fiction, space travel, and political intrigue. That’s not keyword matching—it’s inferring deeper intent.
Take a music streaming service. A KG models artists, genres, moods, instruments, and connections between musicians. If a user plays a lot of indie folk with melancholic lyrics, the KG can recommend a new artist with similar themes and instrumentation, even if that artist is unknown. The system traverses the graph to find other artists on similar paths. This relational depth delivers recommendations that are accurate and fresh. Diverse too. KGs also layer in temporal and spatial context—recommend a restaurant based on where the user is right now, what they eat, nearby cuisine types, and ratings.
Personalized experiences across platforms.
Knowledge graphs do more than recommend items. They craft truly personalized experiences. By building a comprehensive user profile in a KG, organizations unify data about preferences, behaviors, interactions across websites, apps, devices, and physical stores. A travel company uses a KG to learn that a user searches for luxury beach resorts, has a loyalty membership, prefers nonstop flights, and previously booked trips to Southeast Asia. When that user hits the company’s website, the homepage reconfigures—luxury beach packages in Thailand front and center. If the user chats with the company’s chatbot, it leverages the same profile to understand preferences without re-asking basic questions.
In media consumption, a KG tracks viewing history, preferred actors, directors, and genres. A streaming platform can recommend shows and personalize the interface: highlighting content from preferred studios, reordering categories. If a user consistently watches environmental documentaries, the platform prioritizes a “Nature & Science” category. This holistic personalization makes users feel understood by the platform, driving higher engagement.
What are the Key Challenges in Building and Maintaining Knowledge Graphs?
Building knowledge graphs is hard. You have to integrate messy, disparate data sources, ensure data quality and scalability, and handle schema changes while maintaining consistency.
Data integration, quality, and scalability.
The core challenge: integrating data from dozens of different sources. Enterprises have data scattered across relational databases, NoSQL stores, spreadsheets, APIs, and unstructured text. Each uses different models, naming conventions, and types. A customer might be “customer_id” in the CRM, “client_number” in the ERP, and “user_uuid” in analytics. Reconciling these requires sophisticated entity resolution—often machine learning—to identify and merge records representing the same thing. This can eat 60-80% of initial development work.
Data quality is brutal. A knowledge graph is only as good as its data. Inconsistent, wrong, or missing information breaks insights and AI outputs. In a product knowledge graph, if pricing is inconsistent or specs are incomplete, recommendation engines fail. Implementing validation rules, data cleaning pipelines, and continuous monitoring is essential. As data grows, the graph must ingest, store, and query billions of triples at speed. This requires picking the right graph database and designing efficient loading strategies.
Evolving schemas and ensuring consistency.
Knowledge graph schemas aren’t static like relational schemas. They evolve as business needs shift or new data sources integrate. A healthcare knowledge graph might need new disease classifications or procedures as science advances. Managing these changes without breaking existing data or applications is tough. Bad schema evolution creates inconsistencies and broken queries.
Strategies include versioning ontologies and using backward-compatible changes. Semantic versioning signals the impact of changes. Yes, this sounds like ordinary software governance. It is, but with more ways to quietly corrupt meaning. Ensuring consistency across the graph requires continuous validation against the evolving schema, using integrity constraints and conflict resolution policies. If a new rule says a Product can have only one Manufacturer but existing data shows multiple, you need a clear policy to maintain graph integrity.
When Should Organizations Invest in Knowledge Graph Technology?
Invest in knowledge graphs when you’re wrestling with complex data integration, need AI explainability, or want deeper insights from scattered data sources. It’s worth it when existing systems struggle with semantic understanding and contextual relationships.
Identifying use cases where structured knowledge provides competitive advantage.
The investment question hinges on finding specific use cases where knowledge graphs offer real advantage. Think about where traditional databases and data lakes fail. In pharmaceuticals, a knowledge graph links drug compounds, clinical trial results, and patient demographics to accelerate drug discovery. Researchers can query “drugs targeting protein X that showed efficacy in patients with genetic mutation Y”—nearly impossible without a graph. Financial institutions use knowledge graphs to catch fraud by mapping people, accounts, and transactions, uncovering patterns rule-based systems miss. In e-commerce, a knowledge graph powers hyper-personalized recommendations, understanding not just what a customer bought but why. For organizations managing internal documentation, a knowledge graph creates a unified view of enterprise knowledge—policies, procedures, expert profiles, project histories.
Evaluating ROI for knowledge graph implementation.
ROI requires understanding both direct and indirect benefits against costs. Direct benefits show up as improved efficiency, better decisions, and new revenue. A manufacturer using a knowledge graph to connect sensor data and maintenance logs predicts machinery failures more accurately, reducing unplanned downtime. Implementation costs—software licenses, infrastructure, data modeling, and specialized expertise—typically range from $500,000 to several million for an enterprise project, depending on data volume and complexity.
Here is where we push back a little: ROI is not only a finance spreadsheet. Indirect benefits include increased AI explainability, greater data agility, and faster data source integration. A thorough cost-benefit analysis, projecting savings from reduced operational costs and new revenue, helps build internal support for broader rollout.
What is the Future of Knowledge Graphs and AI Visibility?
Knowledge graphs and AI visibility are moving toward increasingly automated construction and dynamic reasoning. This will enable AI to understand, explain, and interact with complex information more intelligently.
Automated knowledge graph construction and reasoning.
Manual work has been the bottleneck in knowledge graph development. Future progress will reduce this through automation. Unsupervised and semi-supervised techniques are extracting entities and relationships from unstructured data. Deep learning models, especially transformers like BERT and GPT-3, are getting good at finding entities and relationships in text at scale. This lets you automatically consume information from documents and web pages, converting raw data to structured triples at massive scale.
But automation does not remove judgment. It moves judgment upstream. Knowledge graph embedding techniques enable more efficient link prediction and completion, inferring missing relationships from patterns. This cuts the need for explicit human curation. Reasoning is evolving too, beyond simple rule-based inference. Neural-symbolic AI combines deep learning with logical reasoning over the graph, identifying implicit connections. A KG might automatically infer “Company X acquired Company Y” implies “Company Y is now a subsidiary of Company X” without that being explicitly stated.
Impact on next-generation AI and the semantic web.
Better knowledge graphs will transform next-generation AI, making systems more transparent and reliable. Instead of black boxes, KGs provide the logic behind decisions, letting users trace from input to output. An AI medical system doesn’t just suggest a diagnosis but shows the knowledge graph snippet of symptoms, conditions, and treatments that led to the conclusion. That explainability is vital for adoption in high-stakes fields. In enterprise AI, KGs power intelligent search that understands intent rather than keywords.
What changes next? The semantic web—machines understanding and processing information meaningfully—stops being a promise. Personalization engines will use richer, more dynamic user profiles. KGs become the backbone, connecting disparate data sources into a machine-readable fabric. This enables advanced data integration and truly intelligent agents capable of autonomous decision-making. KGs become the central nervous system for AI, providing context and structured understanding necessary for genuinely intelligent behavior.
Frequently Asked Questions
How does a knowledge graph directly improve AI model performance?
A knowledge graph gives AI models structured, contextual understanding of entities and relationships. Instead of isolated data points, the AI infers connections, resolves ambiguities, and makes informed decisions. This semantic enrichment leads to more accurate predictions and improved natural language understanding.
What’s the tangible ROI of investing in a knowledge graph?
ROI shows up in several ways. Improved AI accuracy cuts errors and operational costs. Faster model development accelerates time-to-market for new AI products. Better data discoverability empowers data scientists. Ultimately, it drives more effective AI-driven decisions and competitive advantage through deeper insights.
Is building a knowledge graph a one-time project or ongoing overhead?
Building the foundation is a major project. Maintenance is ongoing. Data evolves, new entities emerge, relationships shift. Continuous curation, integrating new data sources, and schema updates keep the graph relevant. Neglect it and its utility degrades fast.
How does a knowledge graph address the “black box” problem in AI?
A knowledge graph enhances AI explainability by providing a transparent, human-readable representation of data and relationships the AI is using. When AI makes a decision, the graph traces the underlying facts and connections that informed it. Stakeholders can understand the reasoning and build trust in AI outputs.
What foundational data infrastructure is needed before starting a knowledge graph initiative?
Establish robust data governance policies and quality standards. Build data integration pipelines to pull from diverse sources. Understand your core business entities and their relationships. Without clean, accessible, well-understood source data, building a valuable knowledge graph becomes nearly impossible.